
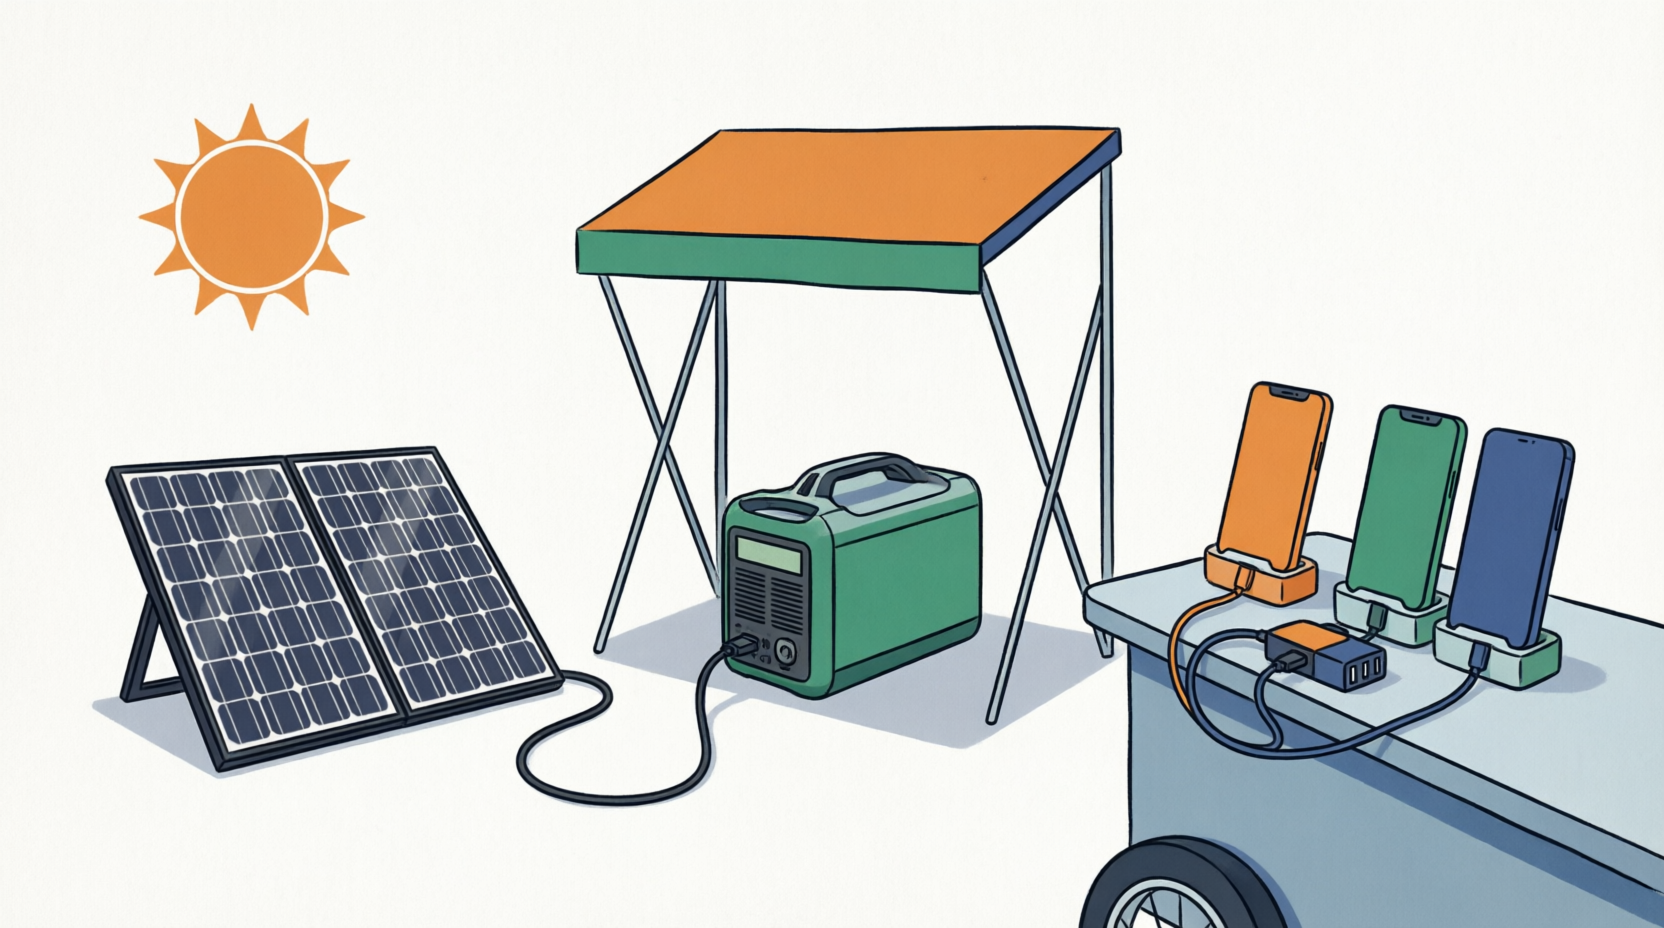
This presentation is exploring practical, market-based tools that can generate real daily income for entrepreneurs living in extreme poverty and in communities without reliable grid power. One of the clearest near-term opportunities is a small solar-powered phone-charging and productive-use kiosk.
We have prepared a complete interactive Deployment Package centered on the ALLPOWERS R600 portable power station paired with a 220 W folding solar panel. The package is designed so that staff, partners, funders, and field operators can examine the same evidence base together.
The package contains three linked sections:
01 — Stakeholder Presentation
A concise briefing that walks through the deployment model, energy-budget realities, revenue drivers, unit economics, and the risks that matter before any scaling decision. It shows how a single kiosk can function as a micro-enterprise financed by microloan rather than pure grant, and what realistic daily throughput and payback look like under Haitian conditions.
02 — Device Runtime & Capacity
An interactive model of the R600’s real limits. You can adjust assumptions (battery usable capacity, solar harvest, efficiency, device mix) and instantly see daytime pass-through performance, reserve runtime with no sun, maximum simultaneous devices, and the resulting profitability picture. This section makes the physical and electrical constraints transparent so decisions are grounded in measured capacity rather than marketing claims.
03 — Off-Grid Charging Hub
A practical reference covering the ideal portable power station and panel configuration, day-to-day field operations, session-level economics, and a pilot governance framework. It translates the technical model into operational guidance: target volume (around 50 charges per day), income goals, pricing
logic, and the simple systems needed to keep a station running reliably in rural or peri-urban Haiti.
Together the three sections answer the questions that usually surface first:
• What can the hardware actually deliver day after day?
• Which services produce the most income per watt-hour?
• What does a viable single-kiosk pilot look like before any expansion?
Open the interactive package here.
Open the Operator Guide here: ENGLISH | CREOLE
The document opens as a self-contained page with tab navigation. It is best viewed on a laptop or tablet; the
interactive tables and live inputs work fully in modern browsers.
Theory of Change
Grounding numbers:
- $400 core capex/kiosk (unit + 220W panel + one 10-port hub, before cart/security/reporting overhead) funded via a $6/week microloan (~15-month payback);
- 590 Wh/day net usable energy budget (mid-case);
- HTG 25 flat session price;
- 50 sessions/day target (33 daytime solar-powered, 17 evening battery-powered);
- 65% feature-phone / 35% smartphone mix;
- Income target HTG 1,250/day (~$10), benchmarked against Haiti’s 2026 minimum wage decree (Segment C — restaurants/agriculture/NGOs — is the closest sector match at 760 HTG/day) and 19% annual inflation;
- and a contractual “reporting stops → repossession” clause that makes real-time data flow a condition of asset retention, not just a nice-to-have.
Inputs → did we deploy what we budgeted?
- Actual capex per kiosk vs. $400 floor (once cart, security box, cabling, and reporting hardware are quoted — our doc flags this as understated)
- Equipment disbursed and terms confirmed per entrepreneur ($6/week, ~67-week payback)
- Units procured vs. deployed (5–10 pilot cohort per our “pilot before scaling” recommendation)
Activities → did we do the things?
- Entrepreneurs trained and onboarded (contract signed: identity/attestation, equipment terms, performance obligations, payment terms)
- Kiosks physically deployed and canopy/shade setup completed (protects the LiFePO4 battery — 45°C shutdown threshold)
- Reporting system live and transmitting from day one (this is the trigger condition in your contract, so it has to be an activity-level KPI, not just an outcome one)
Outputs → immediate, countable effort
Kiosks operational (uptime %)
Entrepreneurs actively operating
- Sessions/day per kiosk, split by daytime-solar vs. evening-battery (target: 33/17)
- Device-type mix actually observed vs. the 65/35 planning assumption — our doc explicitly wants this validated within 4–6 weeks
- Solar Wh harvested/day, battery state-of-charge over time, downtime events, battery cycle count — this is literally the “daily instrumented logging” list our own package specifies as mandatory
- Digital receipts issued per sale (the tracking backbone your doc calls “★ MANDATORY”)
Outcomes → behavior/condition change for the entrepreneur and customer
- Entrepreneur weekly/monthly net income, after the $6 loan installment — tracked against the HTG 25→30 quarterly price-inflation safeguard
- Loan repayment rate and time-to-repay vs. the 67-week/15-month model
- Income relative to Segment C minimum wage (760 HTG/day) and the living-wage empowerment multiple
- Customer-side: reduction in distance/time traveled to charge a phone (softer, interview-based)
- Utilization rate (% of the 590 Wh/day budget actually sold) — our doc treats this as the single lever revenue scales on, so it deserves to be tracked weekly, not just at endline
Impact → long-term systemic change
- Entrepreneur income trajectory over 1–2 years vs. extreme-poverty line ($1,095/yr) and lower-middle-income line ($1,533/yr) — our case study already computes ~3.2x and ~2.3x multiples as the target
- Scaling signal: whether pilot data supports moving to the “Ideal System” architecture (1.1kWh battery, dual 200W panels) for the next cohort
- Reduction in local poverty/vulnerability to economic shocks (only measurable with the control-group comparison below)
Applying our Measurement Cycle
- A — Baseline: pre-kiosk household/vendor income survey for each entrepreneur before their unit goes live; local irradiance data check against the 5.0/5.5/6.0 peak-sun-hour sensitivity band already built into our device model.
- B — Data collection: the daily instrumented log our package specifies (solar Wh, SOC, sessions, revenue, temperature, downtime, cycles, theft/loss, repairs, net income) plus quarterly financial reviews.
- C — Counterfactual: compare entrepreneur income growth against a matched group of market vendors without a kiosk — same market, similar starting income, no kiosk access. Given this is explicitly a “flagship pilot” meant to support fundraising, a credible counterfactual is what will make the case: catalytic capital expecting it to be provable and scalable.
- D — Reporting: the contractual repossession trigger already forces continuous reporting — we use that same data stream for donor reports rather than building a parallel system.
- E — Learning/adapting: two live open questions to resolve mid-pilot — the undisclosed port-throttling behavior (13-port working assumption) and whether the battery is actually running “depleted at sunset” as modeled. Both should have an explicit go/no-go checkpoint.
KPI collection matrix — by interval, source, and format
| Interval | KPI | Source | Channel | Ideal data format |
|---|---|---|---|---|
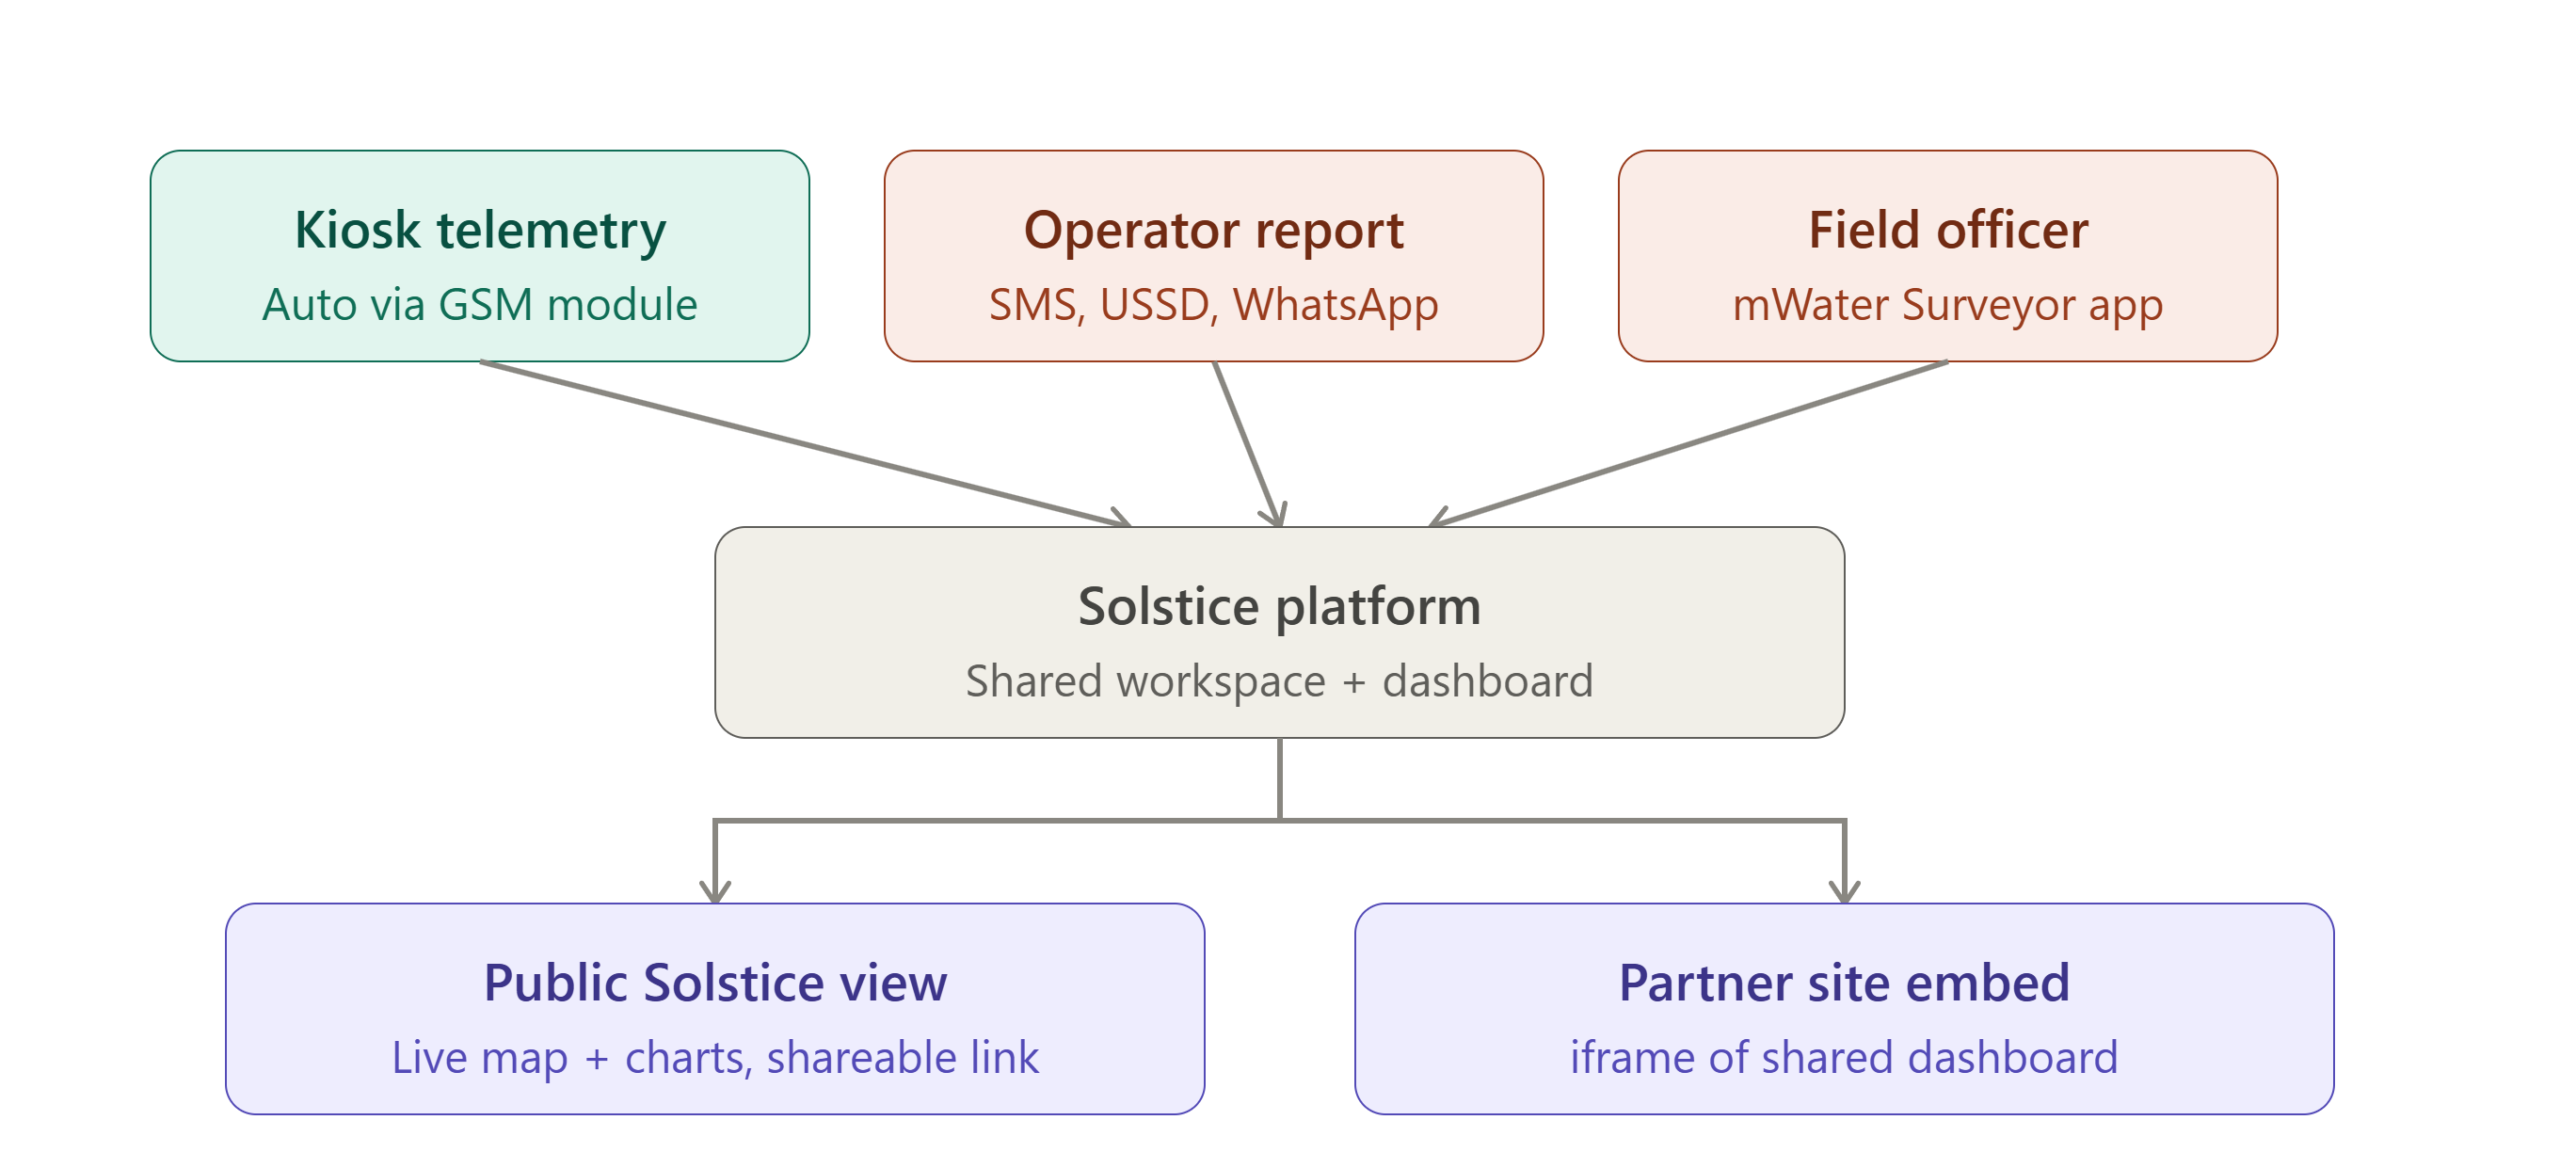
| Continuous (auto) | Sessions, kWh dispensed, solar Wh harvested, SOC, uptime/downtime, battery cycles, temperature | Device (GSM/IoT module) | Cellular telemetry, mWater Surveyor’s own mobile form. Photograph the power meter at kiosk opening and closing. Subtracting these two daily readings gives your total Watt-hours (Wh) dispensed. | Structured JSON/CSV, timestamped |
| Daily | Cash revenue collected, # paying customers | Operator | USSD/SMS/WhatsApp, mWater Surveyor’s own mobile form. Wh × HTG 25 should roughly match reported revenue, and power meter Wh dispensed should roughly track session count at our ~expected Wh/session. | Fixed-format numeric string (e.g. R HTG-amount sessions) |
| Daily | Incidents (theft, damage, closure, cash shortfall) | Operator | SMS free text / WhatsApp / IVR, mWater Surveyor’s own mobile form. | Short text or voice note, flagged for follow-up |
| Weekly | Loan installment paid ($6) | Operator or automated loan ledger | WhatsApp/SMS confirmation, cross-checked against telemetry-derived revenue, mWater Surveyor’s own mobile form. | Boolean + amount |
| Weekly | Photo of handwritten ledger (audit layer) | Operator (if smartphone) or field officer | WhatsApp image / field officer capture. mWater Surveyor’s own mobile form. | Image, OCR’d or manually reconciled |
| Monthly/Quarterly | Full financial review, income vs. HTG 760/day benchmark, price-point review (HTG 25→30 trigger) | Field officer interview | Solstice/ODK structured survey (offline-capable, syncs when connected) | Structured survey response |
| Quarterly | Device-mix validation (35/65 split), battery capacity fade test | Field officer + technician | ODK form + instrument reading. mWater Surveyor’s own mobile form. | Structured + numeric |
| Quarterly | Customer interviews (distance/time saved, satisfaction) | Field officer | ODK form. mWater Surveyor’s own mobile form. | Structured + open text |
| Baseline (one-time) | Pre-kiosk entrepreneur income, control-group vendor income, irradiance check | Field officer | ODK form, physical instrument. mWater Surveyor’s own mobile form. | Structured |
| Endline (~6–12mo) | Income trajectory vs. poverty-line multiples, counterfactual comparison, go/no-go | Analysis of all above | — | Report |
Pilot Logframe
AllPowers R600 off-grid charging kiosk pilot, 5–10 site cohort
| Narrative Summary | Indicators (KPIs) | Means of Verification | Assumptions & Risks |
| GOAL / IMPACT Reduced poverty and greater economic resilience in off-grid Haitian communities via entrepreneur-led solar charging access. | • Entrepreneur income vs. extreme-poverty line ($1,095/yr) and lower-middle-income line ($1,533/yr) • Income growth vs. matched control-group market vendors (no kiosk) | • Endline household income survey (12–24 mo) • Counterfactual comparison, control cohort • Solstice platform — pilot summary report | • Security/political conditions allow continued operation • No currency shock beyond 19% inflation assumption • Local demand for charging access remains stable |
| PURPOSE / OUTCOME Entrepreneurs earn sustainable income above local wage benchmark and repay their loan; customers gain reliable, affordable charging access. | • Net income ≥ HTG 760/day (2026 Segment C minimum wage), sustained 3 consecutive months • ≥90% on-time microloan repayment ($6/week, ~15-mo term) • Reduced customer travel time/distance to charge a device | • Quarterly financial review (mWater Surveyor structured interview) • Loan repayment ledger • Customer interviews (field officer) | • Entrepreneurs keep consistent operating hours • HTG 25 price keeps pace with inflation via quarterly review trigger • No major theft, damage, or extended downtime |
| OUTPUTS Kiosks deployed and operating; entrepreneurs trained; charging sessions delivered; reporting flowing from every site. | • 5–10 kiosks deployed, ≥85% uptime • 5–10 entrepreneurs trained and onboarded • ≥50 sessions/kiosk/day (33 day / 17 evening) within 4–6 weeks • ≥90% daily reporting compliance, any channel | • Deployment log; training sign-off records • Power-meter photo log + operator tally reports • Solstice site records (aggregated daily/weekly) | • R600 units + 220W panels arrive and install on schedule • Digicel/Natcom coverage sufficient for SMS/WhatsApp at each site • Every operator has at least feature-phone access, or a field-visit fallback |
| ACTIVITIES / INPUTS Procure equipment; recruit & train entrepreneurs; deploy kiosks with power meters; stand up reporting channels; run baseline survey. | • $400 core capex/kiosk + inline power meter (~$10–20) • $6/week microloan disbursed per entrepreneur • Field officer visit cadence: biweekly minimum • Solstice / mWater Surveyor account configured pre-launch | • Procurement receipts; loan agreements • Training curriculum + attendance sign-off • Baseline survey dataset (pre-kiosk income) | • Sufficient grant capital secured (GEAPP, Kellogg, FOKAL, etc.) • Haiti Now has field-officer capacity for a 5–10 site pilot cohort |
Data backbone: kiosk-side inline power meter (photographed) + operator tally report (SMS/USSD/WhatsApp, by device tier) + field officer visits via mWater Surveyor, aggregated into Solstice for a shared, real-time dashboard across all partner organizations.